SoundStats

Spring 2023
Made for iPhone on Figma
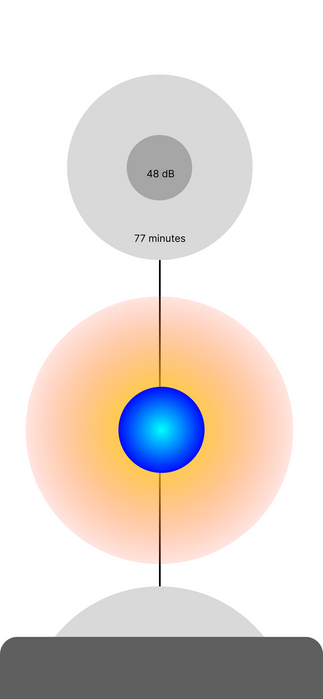
Data visualization project. SoundStats is an app that compiles a user's music listening data into graphics.
Objective
The focus of this project was data visualization. With a topic like music, the rigidity of most statistical models do not match the fluidity and movement associated with sound.
Initial Sketches
The focus of this project was data visualization. With a topic like music, the rigidity of most statistical models does not match the fluidity and movement associated with sound. The intention behind these sketches was to try to represent sound. The main inspiration was sound waves.
Wireframes
The three major takeaways from the wireframes
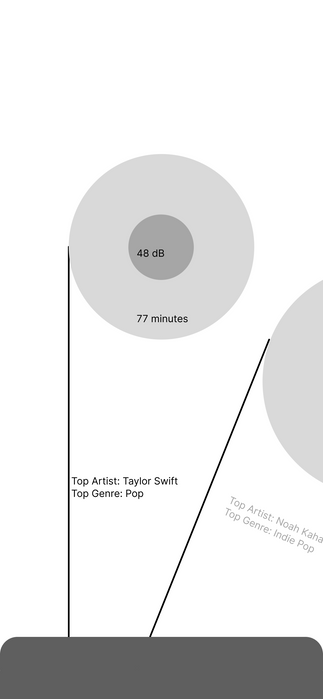
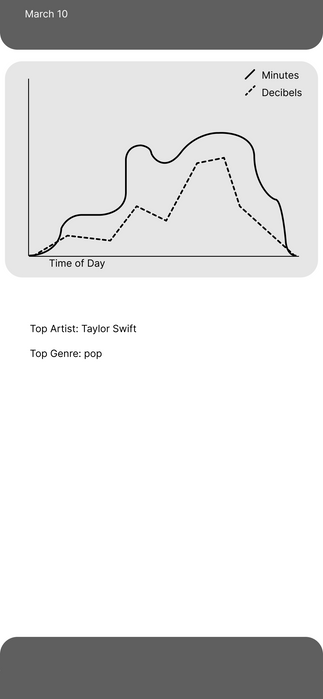
1. Some of the visuals are crowding the screen and competing for focus
2. Graphics are more compelling and visually interesting than charts and graphs
3. Reinforce data visualization with numbers for clarity
Development
Key development decisions
Amorphous shapes in place of circles
Amorphous shapes better align with the intention of this project, to represent music and sound.
Use of color for genre and mood
Users already have strong emotional associations with color, so pairing genre with color builds off that existing relationship. Color decisions were made based off mood associations (e.g. red for rock, pink for pop, yellow for folk)
Written Summaries
Giving written summaries reinforces the data visualization and makes the information more accessible for users.
Typeface
Area
Primary Typeface
Designed by Matthieu Salvaggio
Foundry: Blaze Type


